Creative Marketing
More than Design
LGO is seriously good when it comes to technical stuff but we're also about creative juices. We provide presentations, either virtual or physical, media kit, videos, themes, business cards and even infographics, which are growing popular. Viral marketing ideas can also be arranged.
You can avail of our services individually or we can arrange a whole package depending on your needs. Consult us (Free!) using the form on the right.
» Graphic Design
Business needs an effective grasp and skill set in graphic design if they were to connect to the market. From road signs, to schematics, to inter-office communication, graphic design is part of our daily lives.
Design elements in visual communication are could either be catchy or subtle, but always hold your attention. Drawing someone's attention through creative visual communication is something that doesn't come easily. LGO employs creativity coupled with sensible analysis of what and how you want to portray the brand.
The following are just some of the things we specialize in:
Graphic Design
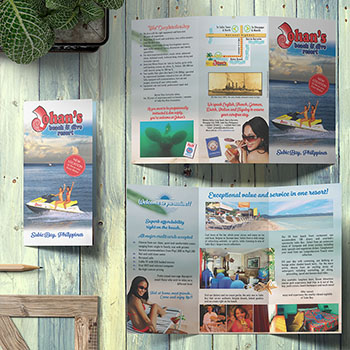
- Brochure Design
- Flyers
- Posters
- Product Packaging
- Signage
- Annual Reports
- Banners
- Newsletters
- Books and Magazines
- Website Redesign and Layout
- Custom background, templates and themes
Corporate Branding
- Logo Design
- Letterhead
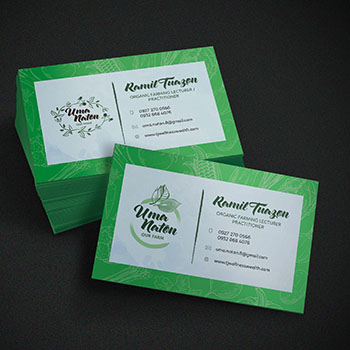
- Business Card Design
- Envelopes
- Corporate Stationery
» Infographics
Surely you have seen one of those cool train maps on stations complete with labels and color coded lines. That’s a good example of an infographic –a visually appealing set of graphs, maps, charts, diagrams and clip-arts arranged in such a way as to present data in a more understandable manner.
The value of simplifying complex information is essential, especially when trying to spot trends or patterns quickly. Infographics is an effective tool for businesses’ daily operations and in reaching out to its target market. It adds that certain visual appeal to any number of otherwise boring articles and study analysis; basically transforming any data (especially stats) into something more eye-friendly.
These nifty infographics are great in:
- epicting a timeline of event
- presenting informational figures or the breakdown of an amount
- showing different phases of a program’s development or cycle
- depicting maps and routes
- stats
- displaying hierarchical and network connections
- explaining How-Tos
Its way easier to share data with others through infographics – just one picture file contains everything as opposed to a whole text they have to read to extract the same information. It’s not surprising that more and more media outlets are now incorporating one in their news reports.
There are instances where an infographic is not enough to contain the whole story, but it’s still a useful overview or introduction to a more detailed analysis that will accompany it.
If you only need one reason to be convinced that you should try using infographics on your posts, remember this: It’s just plain cool.


Connect with Us!